Write a python function that returns for a given real number x.
from math import sin, log
def f(x):
    return 2*sin(x*2) + log(abs(x)) + 1.0
f(1.0)
output : 2.682941969615793
Write a python function that takes
- A function
f(x) - A pair of real numbers
(a,b) - An integer
N
as input and returns the Riemann sum of f(x) on the interval [a,b] with N equal subdivisions.
import numpy as np
from math import pi

def RiemannSum(f, interval, N):
    a,b = interval
    dx = (b-a)/N
    xs = np.linspace(a,b,N)
    fv = np.vectorize(f)
    return dx*sum(fv(xs))

RiemannSum(sin,(0,pi),100)
output : 1.9798338422550525- Pull 100 uniformly random numbers from the interval
as an array
xs. - Add 0 at the beginning of the array, and 1.0 at the end.
- Sort the array
xsfrom smallest to the largest. - Calculate its discrete derivative
ys, i.e. let
from numpy.random import uniform

xs = np.append(np.array([0.0, 1.0]), uniform(0.0,1.0,100))
xs.sort()
ys = np.diff(xs)
ys
array([0.01453743, 0.00156663, 0.00534638, 0.00096398, 0.00508993,
0.00113972, 0.00794464, 0.00759768, 0.01644741, 0.0231801 ,
0.00176902, 0.004525 , 0.00651795, 0.02118523, 0.00246595,
0.00211198, 0.00827289, 0.0095773 , 0.01107778, 0.00116672,
0.00555542, 0.00197661, 0.00577502, 0.00075182, 0.00150462,
0.03740627, 0.00321144, 0.01643881, 0.00950991, 0.00428141,
0.00352253, 0.03885483, 0.04457475, 0.00533743, 0.01936863,
0.00513555, 0.01066424, 0.00294978, 0.00050975, 0.02545816,
0.00922468, 0.00474569, 0.0266568 , 0.00308083, 0.00432957,
0.00399059, 0.00019818, 0.00880208, 0.00519906, 0.01766466,
0.00367313, 0.00523431, 0.011792 , 0.00963488, 0.00749983,
0.01861325, 0.00230705, 0.01085615, 0.01071165, 0.00674251,
0.00317664, 0.00183448, 0.01546867, 0.01741572, 0.00078044,
0.02498636, 0.02380307, 0.00063454, 0.02738756, 0.00156014,
0.01222296, 0.04473237, 0.00149226, 0.00895459, 0.03045946,
0.01131244, 0.00189771, 0.02297412, 0.01214312, 0.00028657,
0.00204055, 0.008042 , 0.00131223, 0.00237684, 0.0159444 ,
0.01281529, 0.01844092, 0.00610445, 0.00847108, 0.00456424,
0.0008383 , 0.01559287, 0.01621418, 0.01133397, 0.00506612,
0.00333 , 0.01781157, 0.0023699 , 0.00521517, 0.00142389,
0.01094116])
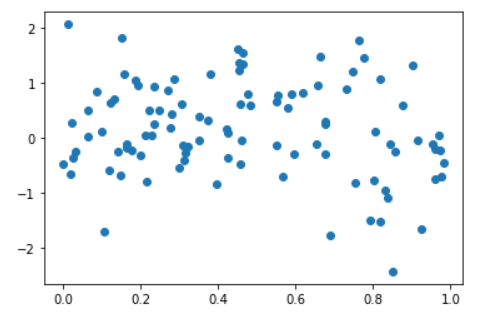
- Pull 100 uniformly random numbers from the interval
xs. - Pull 100 random numbers from the Gaussion distribution with
and
into an array
ys. - Scatter plot
xsagainstysusingmatplotlib
from numpy.random import uniform, normal
from matplotlib.pyplot import scatter

xs = uniform(0.0, 1.0, 100)
ys = normal(0.0, 1.0, 100)

scatter(xs,ys)
output :
Using the numpy library
- Pull a random
matrix
- Calculate its 100-th power
- Calculate its eigen-values
- Calculate is Singular Value Decomposition
A = np.random.rand(100,100)
A100 = A**100
eigval, eigvec = np.linalg.eig(A)
u,s,vh = np.linalg.svd(A)- Pull the text of a novel by Dickens from the website of Gutenberg Project
- Remove all non-alphanumeric characters
- Split the text into words and convert them into lower case
- Count the number of distinct words in the text
- Count how many times each word occurs within the text
from urllib.request import urlopen
from collections import Counter
from re import sub

raw = urlopen("https://www.gutenberg.org/files/1400/1400-0.txt")
text = raw.read().decode('utf-8').lower()
processed = sub('[^a-z ]','',text).split()

len(set(processed))- Write a python function
CountWordsthat takes the URL for a text and returns the number of unique words within the text. - Write a python function
Top20Wordsthat takes the URL for a text and returns the most frequently appearing top 20 words within the text.
def CountWords(url):
    raw = urlopen(url)
    text = raw.read().decode('utf-8').lower()
    processed = sub('[^a-z ]','',text).split()
    return len(set(processed))

CountWords('https://www.gutenberg.org/files/1400/1400-0.txt')
output : 23777
def TopNWords(url, N):
raw = urlopen(url)
text = raw.read().decode('utf-8').lower()
processed = sub('[^a-z ]','',text).split()
res = Counter(processed)
return sorted(res,key=res.get,reverse=True)[:N]
TopNWords('https://www.gutenberg.org/files/1400/1400-0.txt',20)
output :
['the',
'and',
'i',
'to',
'of',
'a',
'in',
'that',
'was',
'it',
'he',
'you',
'had',
'my',
'me',
'his',
'with',
'as',
'at',
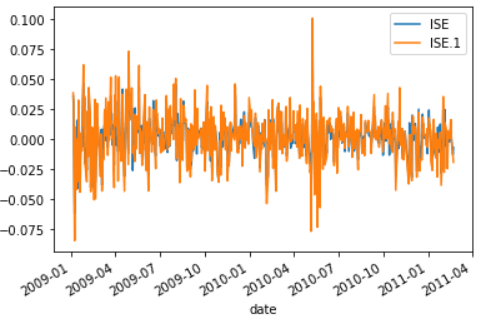
'said']- Pull the IMKB data from UCI using pandas.
- Plot the TL based ISE and USD based ISE columns together in the same graph.
- Calculate how many times
NIKKEIwas higher thanFTSE.
import pandas as pd

data = pd.read_excel('https://archive.ics.uci.edu/ml/machine-learning-databases/00247/data_akbilgic.xlsx', header=1)

data.plot('date',['ISE','ISE.1'])
len(data['date'][data['NIKKEI']>data['FTSE']])